I used the top 100 books on the list of Gutenberg database. With them I cound build a list of 179,044 types and 14,144,013 tokens. Just to state a comparison, "the Second Edition of the 20-volume Oxford English Dictionary contains full entries for 171,476 words in current use, and 47,156 obsolete words. To this may be added around 9,500 derivative words included as subentries"(see the reference). That builds a total of 228,132 entries. So have around 78% of the entries of the Oxford Dictionary.
With this data at hand and some perl scripting, I made the following lists and ordered them by the frequency of occurrence:
1. list of words;
2. list of phones;
3. list of diphones;
4. list of triphones;
5. list of quadriphones;
6. an interface to browse the data (click on the image bellow);

7. log-log graphic of word rank vs. word frequency;

8. log-log graphic of phone rank vs. phone frequency;

Exponential fit of the data:

Semi-logy plot:

9. log-log graphic of diphone rank vs. diphone frequency;

10. log-log graphic of triphone rank vs. triphone frequency;

11. log-log graphic of quadriphone rank vs. quadriphone frequency;

12. frequency of occurrence of a phone given that a certain phone occurred before;

13. frequency of occurrence of a phone given that a certain phone occurs after;

14. Conditiona probability of occurrence of a given phone given that another has occurred.

14. the kullback-leibler distance (relative entropy) between the phones in english and a uniform distributed random variable is: 0.48363 bits;
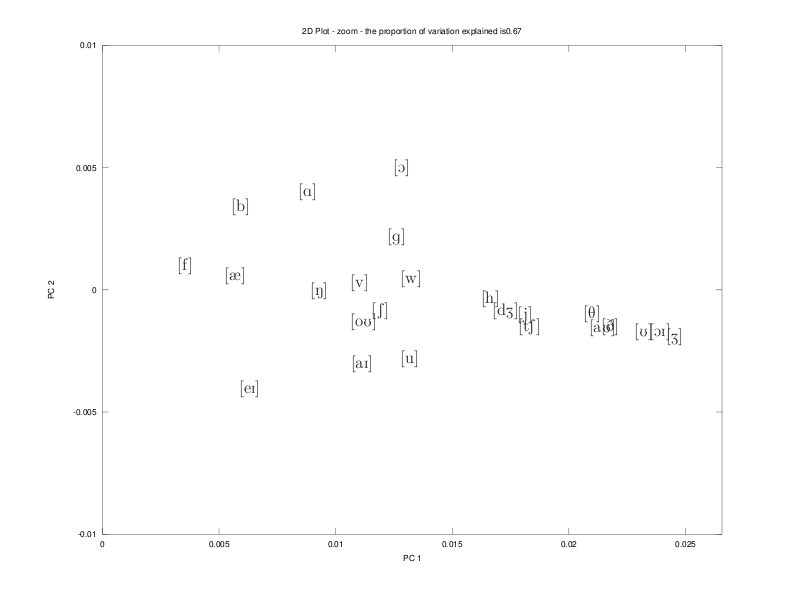
15. considering as a dissimilarity measure between two phones the sum of their individual frequency of occurrence minus the frequency of occurrence of the diphone with this pair of phones, we get the following dissimilarity matrix and we peform a MDS of the data, as shown bellow.


zoom:
16. Words letters-length

17. Frequency of occurrence of words with a certain letters-length normalized by the number of possible permutations of letters with repetition with the same length.

18. Average number of letters in a word across word's rank

19. Words phones-length

20. Frequency of occurrence of words with a certain phonemic-length normalized by the number of possible permutations of phones with repetition with the same length.

21. Average number of phones in a word across word's rank

22. Cumulative probability of phones. The 8 first most frequent phones ([ə, t, n, s, ɪ, r, d, l]) account for half of all phones occurrences in the data.

23. Here are present two types of graphics to verify the contribuition of words frequency to the final phones frequency. The upper plot shows the occurrence of words with a certain phone. The lower one show an extimation of the probability of occurrence of a certain phone across the rank of words.

Good work!!!
ResponderExcluirWhile googling for list of diphones i came across ur blog, but couldn't access ur links. Kindly help me as i have interest in similar study.
-Rahul
Good writing is something I can appreciate. You have made your points in a smart way. I am impressed with how interesting you have been able to present this content. Thanks for sharing a nice information.
ResponderExcluirmadras university distance education results